The following chart is a perfect textbook example of long term upward trending continuity with the foundations of this uptrend starting in 2003. There's an element of a steady uptick in its progression to higher price levels which indicates sustainability in the price trend.
As priced reached the round number of $100 it began to consolidate for three years between 2012 and 2015. This gave enough opportunity for the bulls to keep prices aloft whilst consolidating towards the long term uptrend which successfully found support and set forth on a fresh charge upwards.
On the RSI, highlighted with a yellow rectangle is an area of endurance on the part of this indicator. This reaffirms the notion of strong continuity in the uptrend of this stock and would possibly be wise to be flexible when deciphering the change of momentum with 50 usually the conventional point to watch out for however noticing that the indicator hasn't come close to this mark in recent times but instead found support higher up on the indicator.
In the second quarter of this year price action produced a long tail to the upside but a bearish candle towards the bottom leaving many contemplating whether the short term rally could be withering out. It's likely the case with the differential between the trendline and price diverge quite a bit. We've observed on the chart that this particular stock has a tendency to find stability without venturing too far away from its trendline and perhaps that kind of sentiment could develop in the months ahead.
Weekly
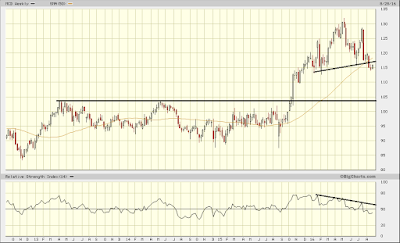
We see a much different picture when we scale down into the weekly with a prominent topping formation in place at the heights of all time highs. Price has broken down beneath the neckline but the 50 moving average still looks sturdy which can offset any downside move.
The RSI has markedly produced a series of lower highs with the most recent generating enough of a kick to throw the indicator below the 50 level. The divergence between the two could spell danger if the price can't find its feet in recovering.
A support level can be found just underneath $105 which is the most probable place price would find itself in if enough downside momentum was given to the sellers.


No comments :
Post a Comment